Why Power BI is a Revolutionary Business Intelligence Tool?
- by 7wData

It has been a while since Microsoft launched its Power BI tool and the way things are going for this fabulous Business Intelligence and Analytics tool it seems it’s only a matter of time before Power BI becomes the tool of choice for BI and analytics in majority of forward-thinking enterprises.
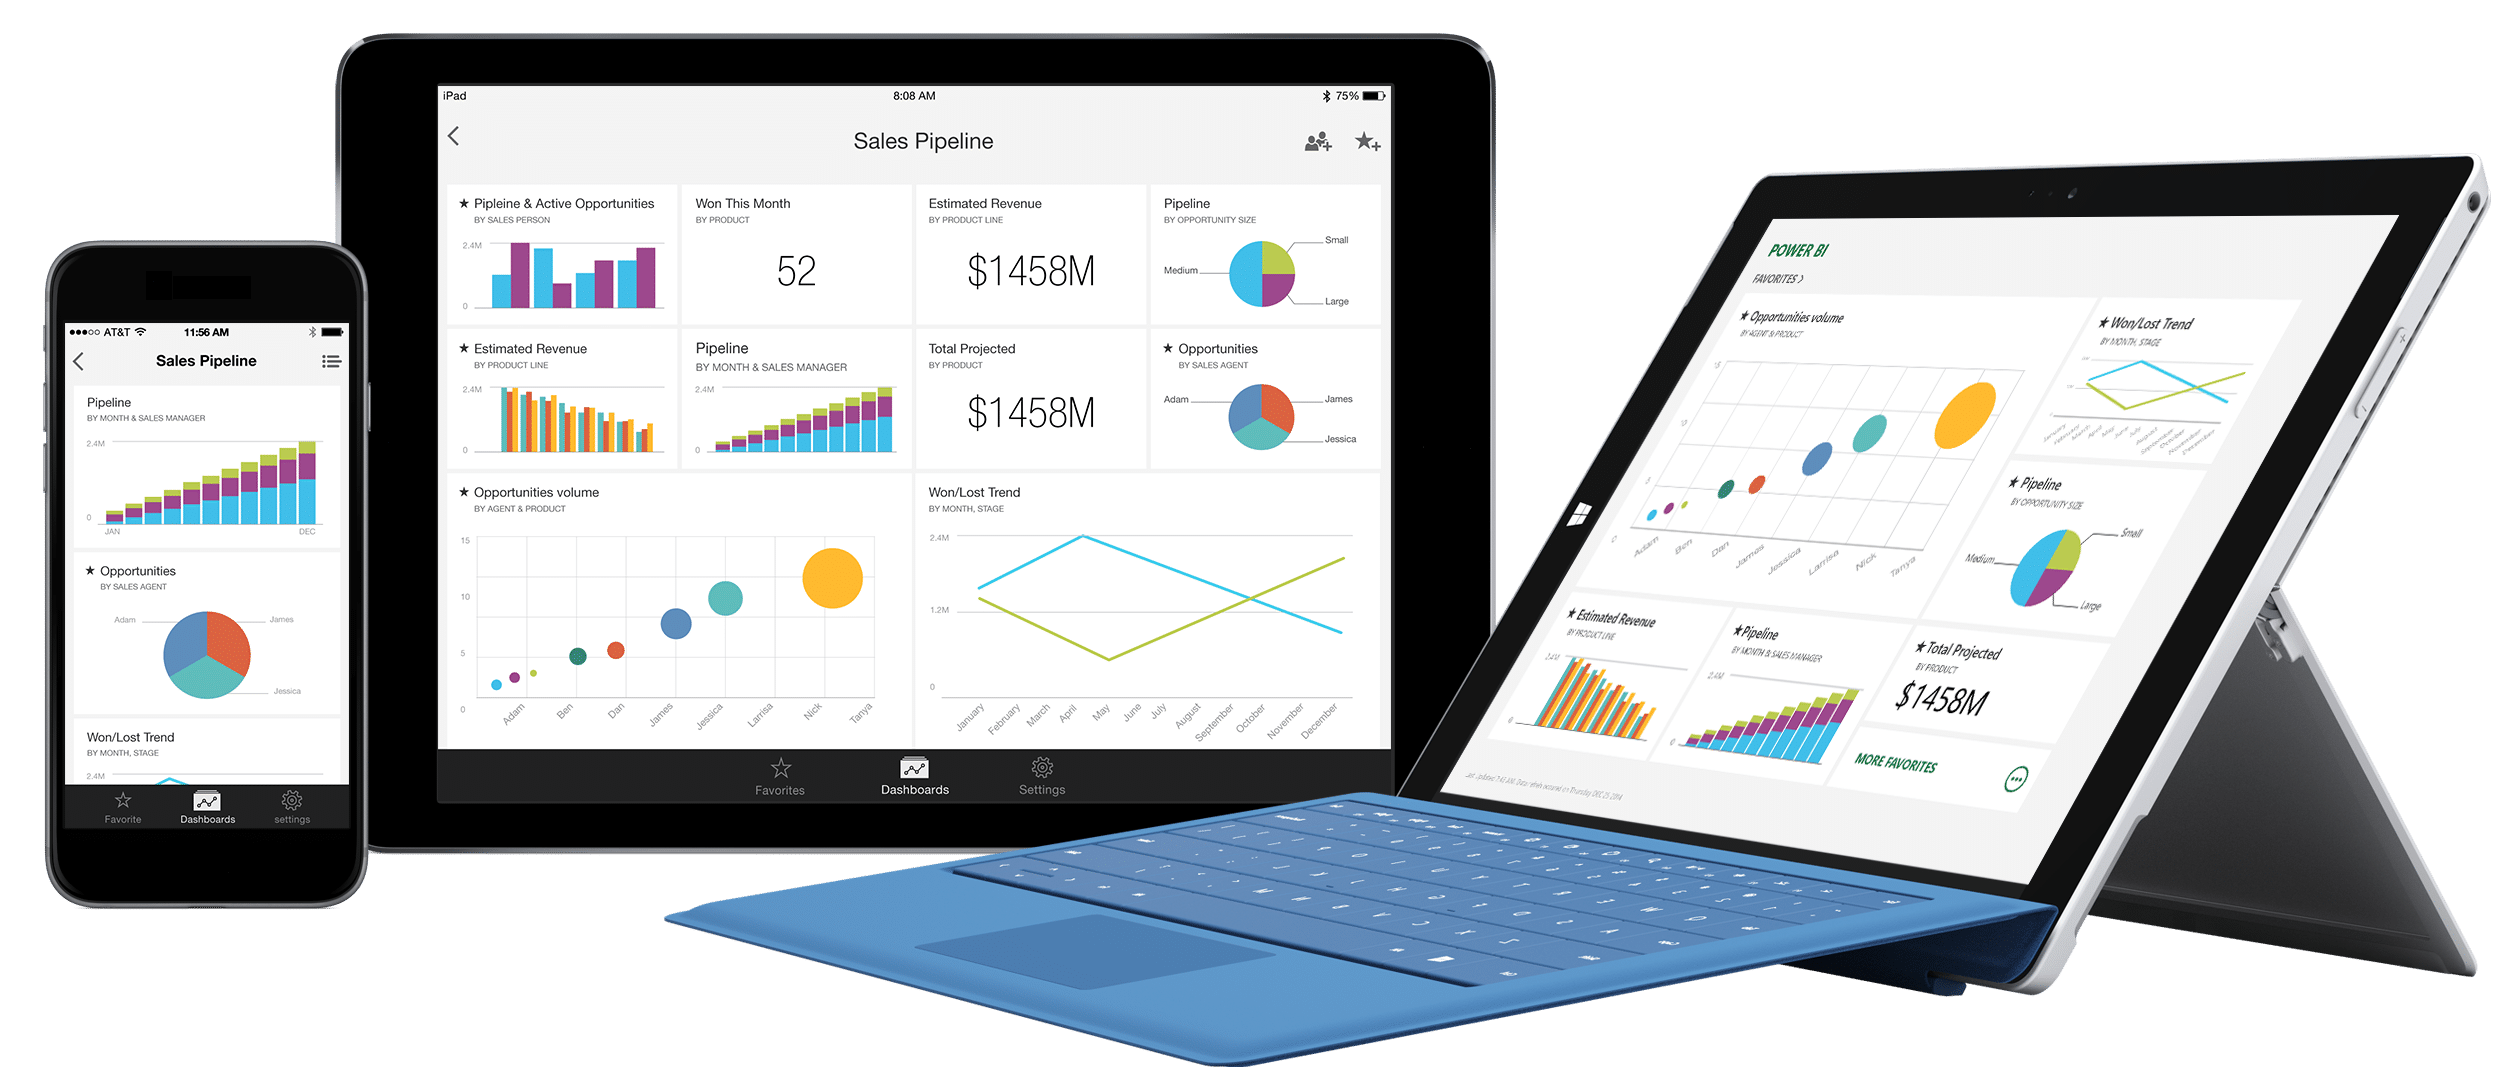
Power BI is a powerful tool in the hands of enterprises that want to extract data from multiple disparate sources in order to derive meaningful insights out of it. It offers unprecedented interactive visualization opportunities along with true self-service analytics capabilities. All this helps to look at the same data from multiple angles and also the reports and dashboards can be created by anybody in the organization without the assistance of IT developers and administrators.
Global Business Intelligence and Analytics Market to Reach $16.9 Billion in 2016 – Gartner
Power BI offers the services which can be directly harnessed from the cloud and it is a big plus point when it comes to how BI can be deployed. It also has a desktop version called the Power BI Desktop. The whole range of usual tasks can be performed with Power BI namely data preparation, discovery and designing of interactive dashboards. Microsoft also went one step ahead by offering the embedded version of Power BI on its highly popular Azure cloud platform.
Microsoft already had a very prominent presence in the data analysis segment with its popular SSAS (SQL Server Analysis Service). But it did not have a strong presence in the Business Intelligence delivery or OLAP (Online Analytical Processing) segment. Excel has been for long Microsoft’s attempt at being a presentation layer for its data analysis tools. But Excel has some drawbacks like limited memory, and data integrity issues that make it not very appealing to enterprise clients.
But Power BI is a tool that takes what is best about MS Excel and takes it to a whole new orbit. It is a whole new experience to working with tools like Power Query for data extraction and transformation, Power Pivot which is deployed for data modeling and analyzing, and finally Power View to distinctly map the data and visualize it in unprecedented ways. Power BI puts all these tools into a consolidated manner and makes it easier to work without having to depend on MS Office.
It can be used for all types of sharing of datasets, interactive dashboards and reports. Since with Power BI it is possible to manage and deploy analytical applications on the cloud, it makes it that much easier to collaborate and share the insights in hitherto unheard ways. The analysis of data takes on a very agile form and it even supports user generated data sets.
71% enterprises to adopt hybrid or cloud-only analytics by 2018 – IDG Research Report
This tool firmly puts the power in the hands of the users with powerful features and applications like changing data dimensions and measures in the fly and coming up with calculated columns. It is much better than working on a data warehouse tool which exclusively requires the whole gamut of processes involved in Extract-Transform-Load for uploading data, then coming up with data cubes and finally making sense of it.
[Social9_Share class=”s9-widget-wrapper”]
Upcoming Events
Evolving Your Data Architecture for Trustworthy Generative AI
18 April 2024
5 PM CET – 6 PM CET
Read MoreShift Difficult Problems Left with Graph Analysis on Streaming Data
29 April 2024
12 PM ET – 1 PM ET
Read More


