
A Visual and Interactive Guide to the Basics of Neural Networks
- by 7wData
I’m not a machine learning expert. I’m a software engineer by training and I’ve had little interaction with AI. I had always wanted to delve deeper into machine learning, but never really found my “in”. That’s why when Google open sourced TensorFlow in November 2015, I got super excited and knew it was time to jump in and start the learning journey. Not to sound dramatic, but to me, it actually felt kind of like Prometheus handing down fire to mankind from the Mount Olympus of machine learning. In the back of my head was the idea that the entire field of Big Data and technologies like Hadoop were vastly accelerated when Google researchers released their Map Reduce paper. This time it’s not a paper – it’s the actual software they use internally after years and years of evolution.
So I started learning what I can about the basics of the topic, and saw the need for gentler resources for people with no experience in the field. This is my attempt at that.
Let’s start with a simple example. Say you’re helping a friend who wants to buy a house. She was quoted $400,000 for a 2000 sq ft house (185 meters). Is this a good price or not?
It’s not easy to tell without a frame of reference. So you ask your friends who have bought houses in that same neighborhoods, and you end up with three data points:
Personally, my first instinct would be to get the average price per sq ft. That comes to $180 per sq ft.
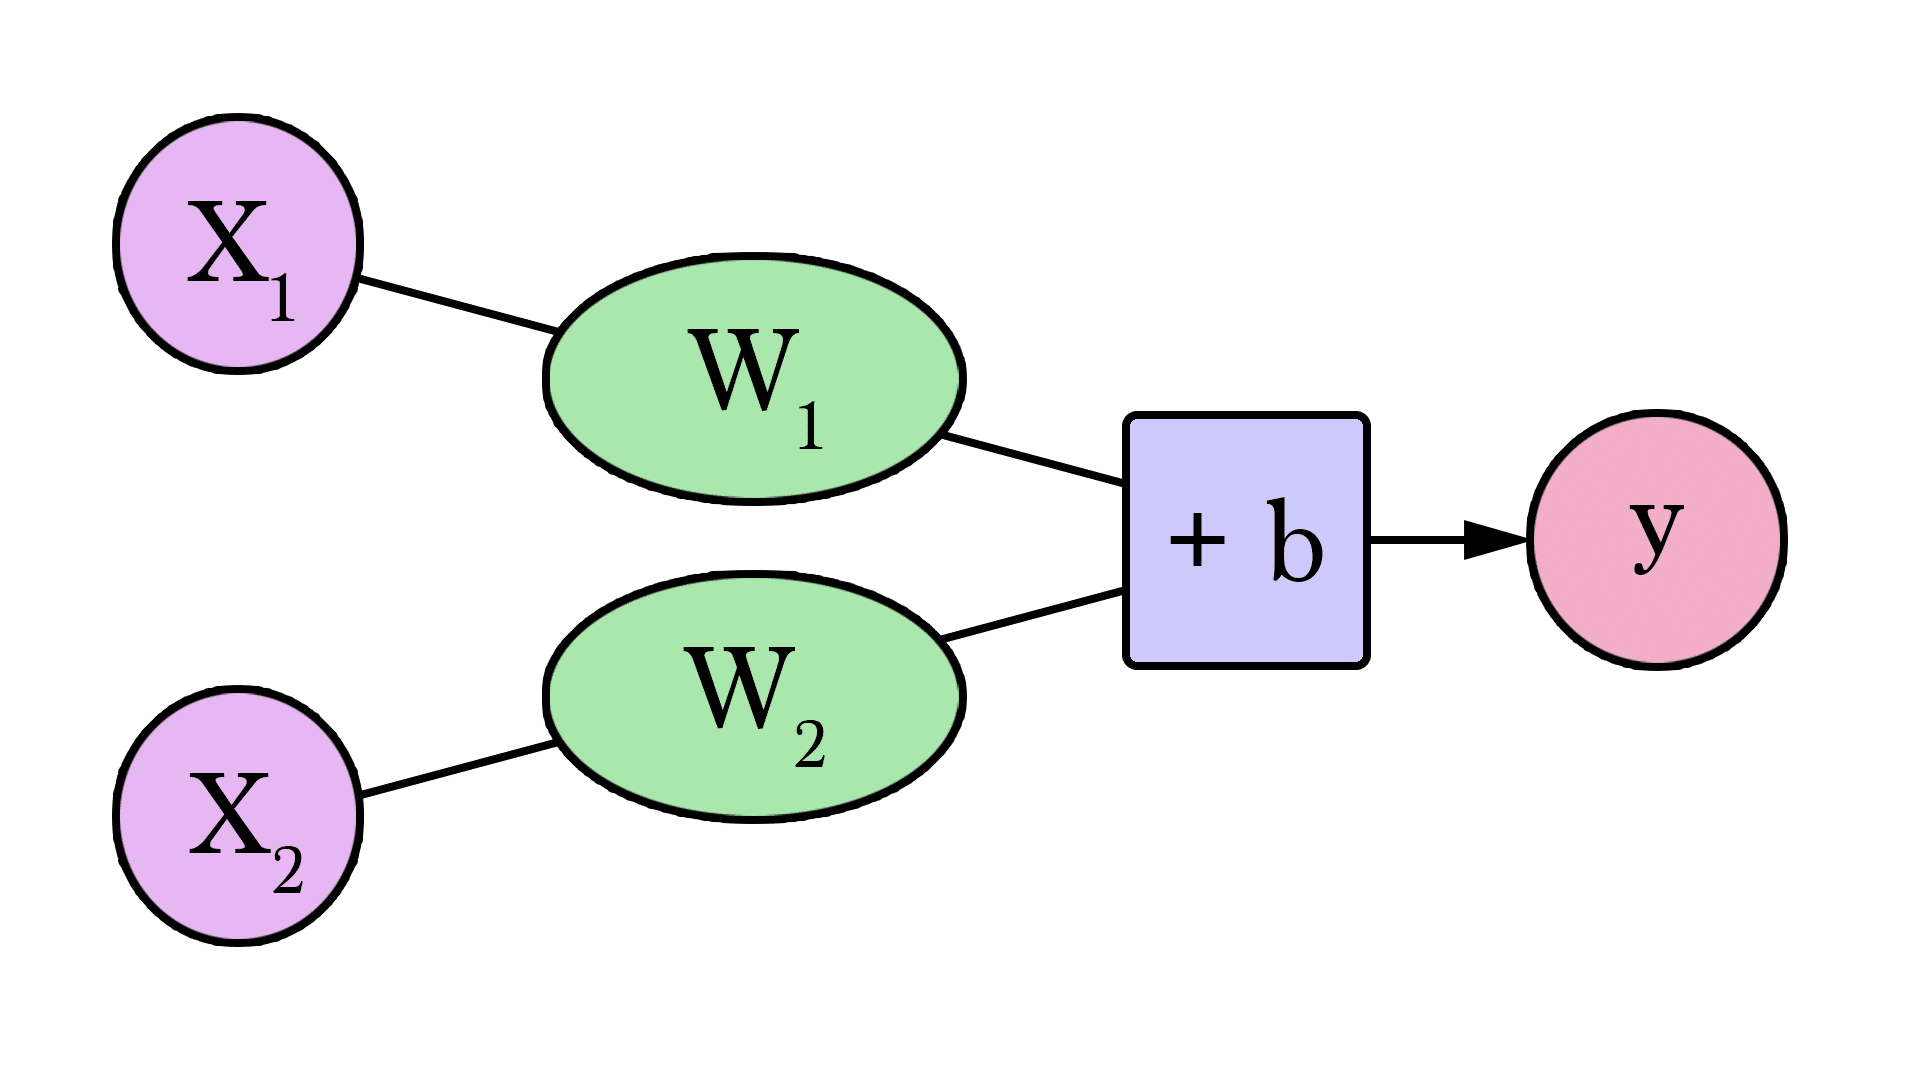
Welcome to your first neural network! Now it’s not quite at Siri level yet, but now you know the fundamental building block. And it looks like this:
Diagrams like this show you the structure of the network and how it calculates a prediction. The calculation starts from the input node at the left. The input value flows to the right. It gets multiplied by the weight and the result becomes our output.
Multiplying 2,000 sq ft by 180 gives us $360,000. That’s all there is to it at this level. Calculating the prediction is simple multiplication. But before that, we needed to think about the weight we’ll be multiplying by. Here we started with an average, later we’ll look at better algorithms that can scale as we get more inputs and more complicated models. Finding the weight is our “training” stage. So whenever you hear of someone “training” a neural network, it just means finding the weights we use to calculate the prediction.
This is a form of prediction. This is a simple predictive model that takes an input, does a calculation, and gives an output (since the output can be of continuous values, the technical name for what we have would be a “regression model”)
Let us visualize this process (for simplicity, let’s switch our price unit from $1 to $1000. Now our weight is 0.180 rather than 180):
Can we do better than estimate the price based on the average of our data points? Let’s try. Let’s first define what it means to be better in this scenario. If we apply our model to the three data points we have, how good of a job would it do?
That’s quite a bit of yellow. Yellow is bad. Yellow is error. We want to shrink yellow as much as we can.
Here we can see the actual price value, the predicted price value, and the difference between them. Then we’ll need to sum up the difference so we have a number that tells us how much error there is in this prediction model. The problem is, the 3rd row has -63 as its value. We have to deal with this negative value if we want to use the difference between the prediction and price as our error measuring stick. That’s one reason why we introduce an additional column that shows the error squared, thus getting rid of the negative value.
This is now our definition of doing better – a better model is one that has less error. Total error is measured as the average of the errors for each point in our data set. For each point, the error is measured by the difference between the actual value and the predicted value, raised to the power of 2. This is called Mean Square Error.
[Social9_Share class=”s9-widget-wrapper”]
Upcoming Events
Evolving Your Data Architecture for Trustworthy Generative AI
18 April 2024
5 PM CET – 6 PM CET
Read MoreShift Difficult Problems Left with Graph Analysis on Streaming Data
29 April 2024
12 PM ET – 1 PM ET
Read More
