
How to do Data Science
- by 7wData
This blog post is authored by Brandon Rohrer, Senior Data Scientist at Microsoft.
The raw stuff of data science is a collection of numbers and names. Measurements, prices, dates, times, products, titles, actions—everything is fair game. You can use images, text, audio, video and other complex data too, as long as you have a way to reduce it to numbers and names.
The mechanics of getting data can be quite complex. Data engineers are ninjas. But this guide is focused on the data science, so I’ll leave that topic for another time.
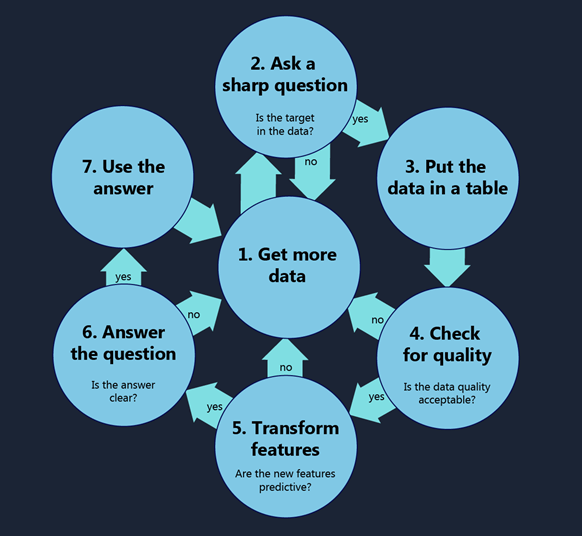
Data science is the process of using names and numbers to answer a question. The more precisely you ask your question the better chance you have of finding an answer you are satisfied with. When choosing your question, imagine that you are approaching an oracle that can tell you anything in the universe, as long as the answer is a number or a name. It’s a mischievous oracle, and its answer will be as vague and confusing as it can get away with. You want to pin it down with a question so airtight that the oracle can’t help but tell you what you want to know. Examples of poor questions are “What can my data tell me about my business?”, “What should I do?” or “How can I increase my profits?” These leave wiggle room for useless answers. In contrast, clear answers to questions like “How many Model Q Gizmos will I sell in Montreal during the third quarter?” or “Which car in my fleet is going to fail first?” are impossible to avoid.
Now that you have a question, check to see whether you have examples of the answer in your data. If your question is “What will my stock’s sale price be next week?” then make sure your data includes your stock’s price history. If your question is “How many hours until a model 88 aircraft engine fails?” then make sure your data includes failure times of several model 88 engines. These examples of answers are called your target. Your target is the quantity or category that you want to predict or assign in the future. If you don’t have any target data, go back to Step 1 and Get More Data. You won’t be able to answer your question without it.
Most machine learning algorithms assume your data is in a table. Each row is one event or item or instance. Each column is one feature or attribute of all those rows. A data set describing American football might have each row represent a game with columns for home_team, visiting_team, home_team’s_score, visiting_team’s_score, date, start_time, attendance and so on. The columns can be arbitrarily detailed and there can be as many as you like. The football data set could even include a column as detailed as yards_rushed_by_the_home_team_during_the_final_two_minutes_of_the_first_half.
There are lots of ways to break a data set into rows, but only one way will help you answer your question: each row needs to have one and only one instance of your target. Consider data gathered from a retail store. It could be condensed to one transaction per row, one day per row, one store per row, one customer per row, and many other row representations. If your question is “Will a customer return for a second visit?” then one customer per row is the right way for you to organize it. Your target, whether_the_customer_returned, applies once and only once to each individual and will be present on each row. That wouldn’t happen if there were one store per row or one day per row. If you end up with a single target column across all your rows, then you know you chose the right row representation.
You may have to roll some data up to get it to fit. For instance, if your question is “How many lattes will I sell per day?” then you’ll want one day per row in your table, with a target column of number_of_lattes_sold. But your data may be recorded as a list of latte sales transaction with the time and date of each. In order to fit this into a one-day-per-row format, it is first necessary to roll up the data, that is, to combine a bunch of measurements into a single one.
[Social9_Share class=”s9-widget-wrapper”]
Upcoming Events
Evolving Your Data Architecture for Trustworthy Generative AI
18 April 2024
5 PM CET – 6 PM CET
Read MoreShift Difficult Problems Left with Graph Analysis on Streaming Data
29 April 2024
12 PM ET – 1 PM ET
Read More
