
Meet SemSpect: A Different Approach to Graph Visualization
- by 7wData
Understanding large graphs is challenging. Sure, a proper Cypher query can retrieve valuable information. But how do you find the pivotal queries when the structure of your graph is not known? In this post, I discuss SemSpect: a tool that makes use of a visualization paradigm that allows you to ad-hoc visualize and interactively query large graphs to understand, analyze, and track your graph data as a whole.
Given a large property graph, how do you gain meaningful insights from it?
For instance, what groups of nodes relate to each other? Are there any characteristics in the network or unexpected connections?
Exploring such patterns can help you realize the overall graph structure and to discover anomalies in the data. Trying to invent Cypher queries to make all those patterns explicit is not always a reasonable solution.
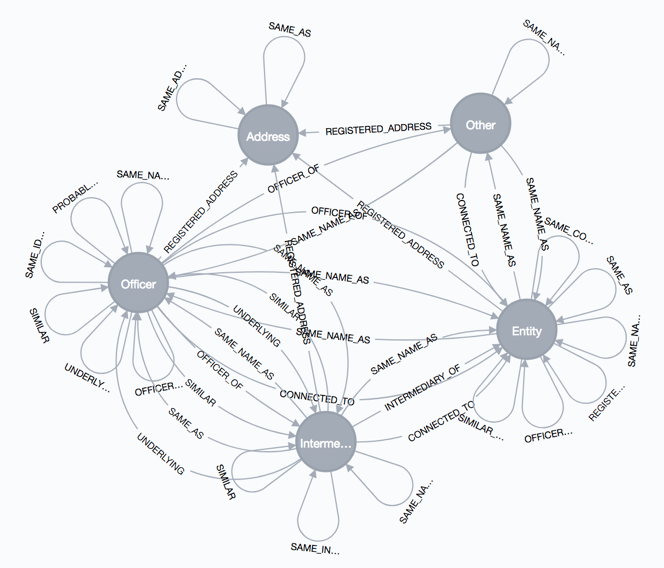
Fortunately, the Neo4j procedures provide some helpful features in this respect. They ship with the optional APOC procedure library available from Neo4j. For instance, to depict the overall structure of a Neo4j graph you can use:
For the Neo4j dump of the Paradise Papers data from the ICIJ, the result looks as follows:
While already helpful, this graph visualization is just a static rendering and does not expose any relationships to nodes of the underlying original graph. Furthermore, one can imagine that this meta-graph may be itself confusing in case of more diverse node labels or relationships.
According to our experience with business-critical graphs, an effective graph dataset needs data-driven exploration and data-sensitive visualization to make sense of large graphs.
Our SemSpect tool aims at enabling even domain and query novices to carry out sophisticated graph research by interacting with a visual representation of the data network.
This data visualization approach is different from commonly known property graph renderings. SemSpect groups nodes by their label and aggregates relationships between groups unless the user asks for details. That difference is key to keeping user orientation and information for large graphs.
Let's see how this works by playing with the previously mentioned Paradise Papers: consider if a user selects the group as the root of an exploration query (see the image below).
SemSpect depicts this group as a labeled circle showing its number of nodes in the center. The tool guides the user by offering data-driven choices for expanding the exploration graph with the help of a menu to choose a group (called a category in SemSpect) and a relationship for instant exploration.
[Social9_Share class=”s9-widget-wrapper”]
Upcoming Events
Evolving Your Data Architecture for Trustworthy Generative AI
18 April 2024
5 PM CET – 6 PM CET
Read MoreShift Difficult Problems Left with Graph Analysis on Streaming Data
29 April 2024
12 PM ET – 1 PM ET
Read More
