
Text Visualization and Search
- by 7wData
When considering text visualization or visual text analytics, search has to be considered a significant application. Tag clouds originated as a form of faceted search.
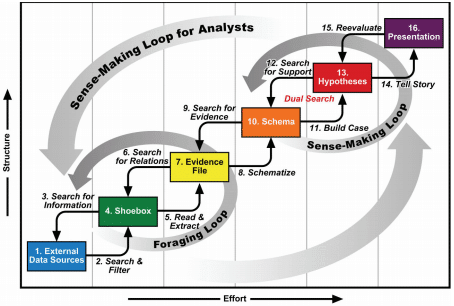
But first, take a step back and consider what search really is. I like Card and Pirolli’s sense-making loop:
A key takeaway from this analysis is that “search” is really made up of many different tasks. As such, there are likely many different user components that address these different tasks. If you take a look at various search interfaces you’ll see all these components working together. Amazon has a search box of course, plus facets for refinement (on the left sidebar), plus a hierarchy of departments (in the center, for browsing down through a hierarchy). Or, if you consider a news portal, such as google or bing, elements include the search and facets; as well as individual stories including headlines, a lead sentence or paragraph, and possibly a photo. Textually, there are things happening at the level of individual words and phrases, lines, (like the headline or a keyword in context), and paragraphs.
There is a nice repository of text visualizations at textvis.lnu.se. In mid-January 2016, there were 250 text visualizations listed from 1976 – 2015. Looking through these visualizations, you can enumerate whether these visualizations depict text at the level of words, sentences, paragraphs, full documents or down to individual characters. Some don’t have any text at all. Here’s the results:
*totals do not add up to 100%: some visualizations use multiple techniques.
There’s a big discrepancy here.
[Social9_Share class=”s9-widget-wrapper”]
Upcoming Events
Evolving Your Data Architecture for Trustworthy Generative AI
18 April 2024
5 PM CET – 6 PM CET
Read MoreShift Difficult Problems Left with Graph Analysis on Streaming Data
29 April 2024
12 PM ET – 1 PM ET
Read More
