

Is dimensional modeling dead?
Before I give you an answer to this question let's take a step back and first have a look at what we mean by dimensional data modelling.
Why do we need to model our data?
Contrary to a common misunderstanding, it is not the only purpose of data models to serve as an ER diagram for designing a physical database. Data models represent the complexity of business processes in an enterprise. They document important business rules and concepts and help to standardise key enterprise terminology. They provide clarity and help to uncover blurred thinking and ambiguities about business processes. Furthermore, you can use data models to communicate with other stakeholders. You would not build a house or a bridge without a blueprint. So why would you build a data application such as a data warehouse without a plan?
Why do we need dimensional models?
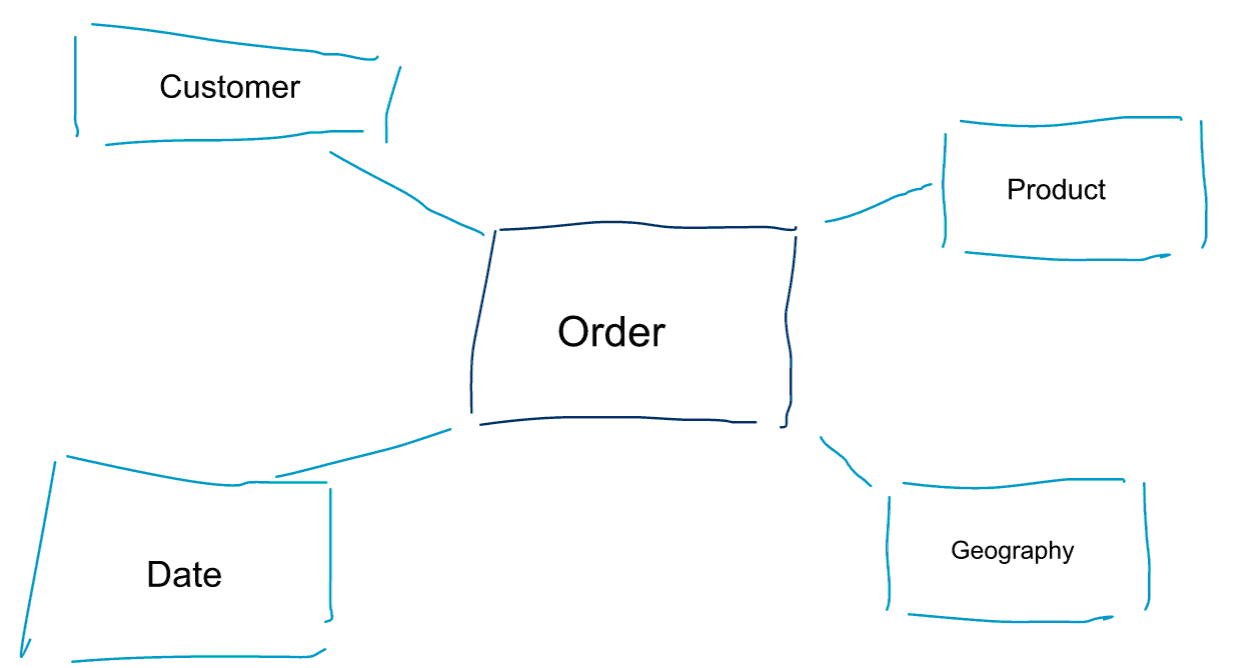
Dimensional modelling is a special approach to modelling data. We also use the words data mart or star schema as synonyms for a dimensional model. Star schemas are optimised for data analytics. Have a look at the dimensional model below. It is quite intuitive to understand. We immediately see how we can slice and dice our order data by customer, product or date and measure the performance of the Orders business process by aggregating and comparing metrics.
One of the core ideas about dimensional modelling is to define the lowest level of granularity in a transactional business process. When we slice and dice and drill into the data, this is the leaf level from which we can’t drill down any further. Put in another way, the lowest level of granularity in a star schema is a join of the fact to all dimension tables without any aggregations.
Data Modelling vs Dimensional Modelling
In standard data modelling we aim to eliminate data repetition and redundancy. When a change happens to data we only need to change it in one place. This also helps with data quality. Values don't get out of sync in multiple places. Have a look at the model below. It contains various tables that represent geographic concepts. In a normalised model we have a separate table for each entity. In a dimensional model we just have one table: geography. In this table, cities will be repeated multiple times. Once for each city. If the country changes its name we have to update the country in many places
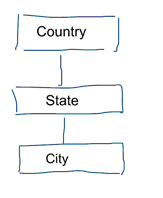
Note: Standard data modelling is also referred to as 3NF modelling.
The standard approach to data modelling is not fit for purpose for Business Intelligence workloads. A lot of tables result in a lot of joins. Joins slow things down. In data analytics we avoid them where possible. In dimensional models we de-normalize multiple related tables into one table, e.g. the various tables in our previous example can be pre-joined into just one table: geography.
So why do some people claim that dimensional modelling is dead?
I think you would agree that data modelling in general and dimensional modelling in particular is quite a useful exercise. So why do some people claim that dimensional modelling is not useful in the era of big data and Hadoop?
As you can imagine there are various reasons for this.
The Data Warehouse is dead Confusion
First of all, some people confuse dimensional modelling with data warehousing. They claim that data warehousing is dead and as a result dimensional modelling can be consigned to the dustbin of history as well. This is a logically coherent argument. However, the concept of the data warehouse is far from obsolete. We always need integrated and reliable data for populating our BI dashboards. If you want to find out more I recommend our training course Big Data for Data Warehouse Professionals. In the course I go into the details and explain how the data warehouse is as relevant as ever. I will also show how emerging big data tools and technologies are useful for data warehousing.
The Schema on Read Misunderstanding
The second argument I frequently hear goes like this. ‘We follow a schema on read approach and don’t need to model our data anymore’. In my opinion, the concept of schema on read is one of the biggest misunderstandings in data analytics. I agree that it is useful to initially store your raw data in a data dump that is light on schema. However, this argument should not be used as an excuse to not model your data altogether. The schema on read approach is just kicking down the can and responsibility to downstream processes. Someone still has to bite the bullet of defining the data types. Each and every process that accesses the schema-free data dump needs to figure out on its own what is going on. This type of work adds up, is completely redundant, and can be easily avoided by defining data types and a proper schema.
Denormalization revisited. The physical aspects of the model.
Are there actually some valid arguments for declaring dimensional models obsolete? There are indeed some better arguments than the two I have listed above. They require some understanding of physical data modelling and the way Hadoop works. Bear with me.
Earlier on I briefly mentioned one of the reasons why we model our data dimensionally. It’s in relation to the way that data is stored physically in our data store. In standard data modelling each real world entity gets its own table. We do this to avoid data redundancy and the risk of data quality issues creeping into our data. The more tables we have the more joins we need. That’s the disadvantage. Table joins are expensive, especially when we join a large numbers of records from our data sets. When we model data dimensionally we consolidate multiple tables into one. We say that we pre-join or de-normalise the data. We now have less tables, less joins, and as a result lower latency and better query performance.
Take part in the discussion of this post on LinkedIn
Taking de-normalization to its full conclusion
Why not take de-normalisation to its full conclusion? Get rid of all joins and just have one single fact table? Indeed this would eliminate the need for any joins altogether. However, as you can imagine, it has some side effects. First of all, it increases the amount of storage required. We now need to store a lot of redundant data. With the advent of columnar storage formats for data analytics this is less of a concern nowadays. The bigger problem of de-normalization is the fact that each time a value of one of the attributes changes we have to update the value in multiple places - possibly thousands or millions of updates. One way of getting around this problem is to fully reload our models on a nightly basis. Often this will be a lot quicker and easier than applying a large number of updates. Columnar databases typically take the following approach. They first store updates to data in memory and asynchronously write them to disk.
Data distribution on a distributed relational database (MPP)
When creating dimensional models on Hadoop, e.g. Hive, SparkSQL etc. we need to better understand one core feature of the technology that distinguishes it from a distributed relational database (MPP) such as Teradata etc. When distributing data across the nodes in an MPP we have control over record placement. Based on our partitioning strategy, e.g. hash, list, range etc. we can co-locate the keys of individual records across tabes on the same node. With data co-locality guaranteed, our joins are super-fast as we don’t need to send any data across the network. Have a look at the example below. Records with the same ORDER_ID from the ORDER and ORDER_ITEM tables end up on the same node.
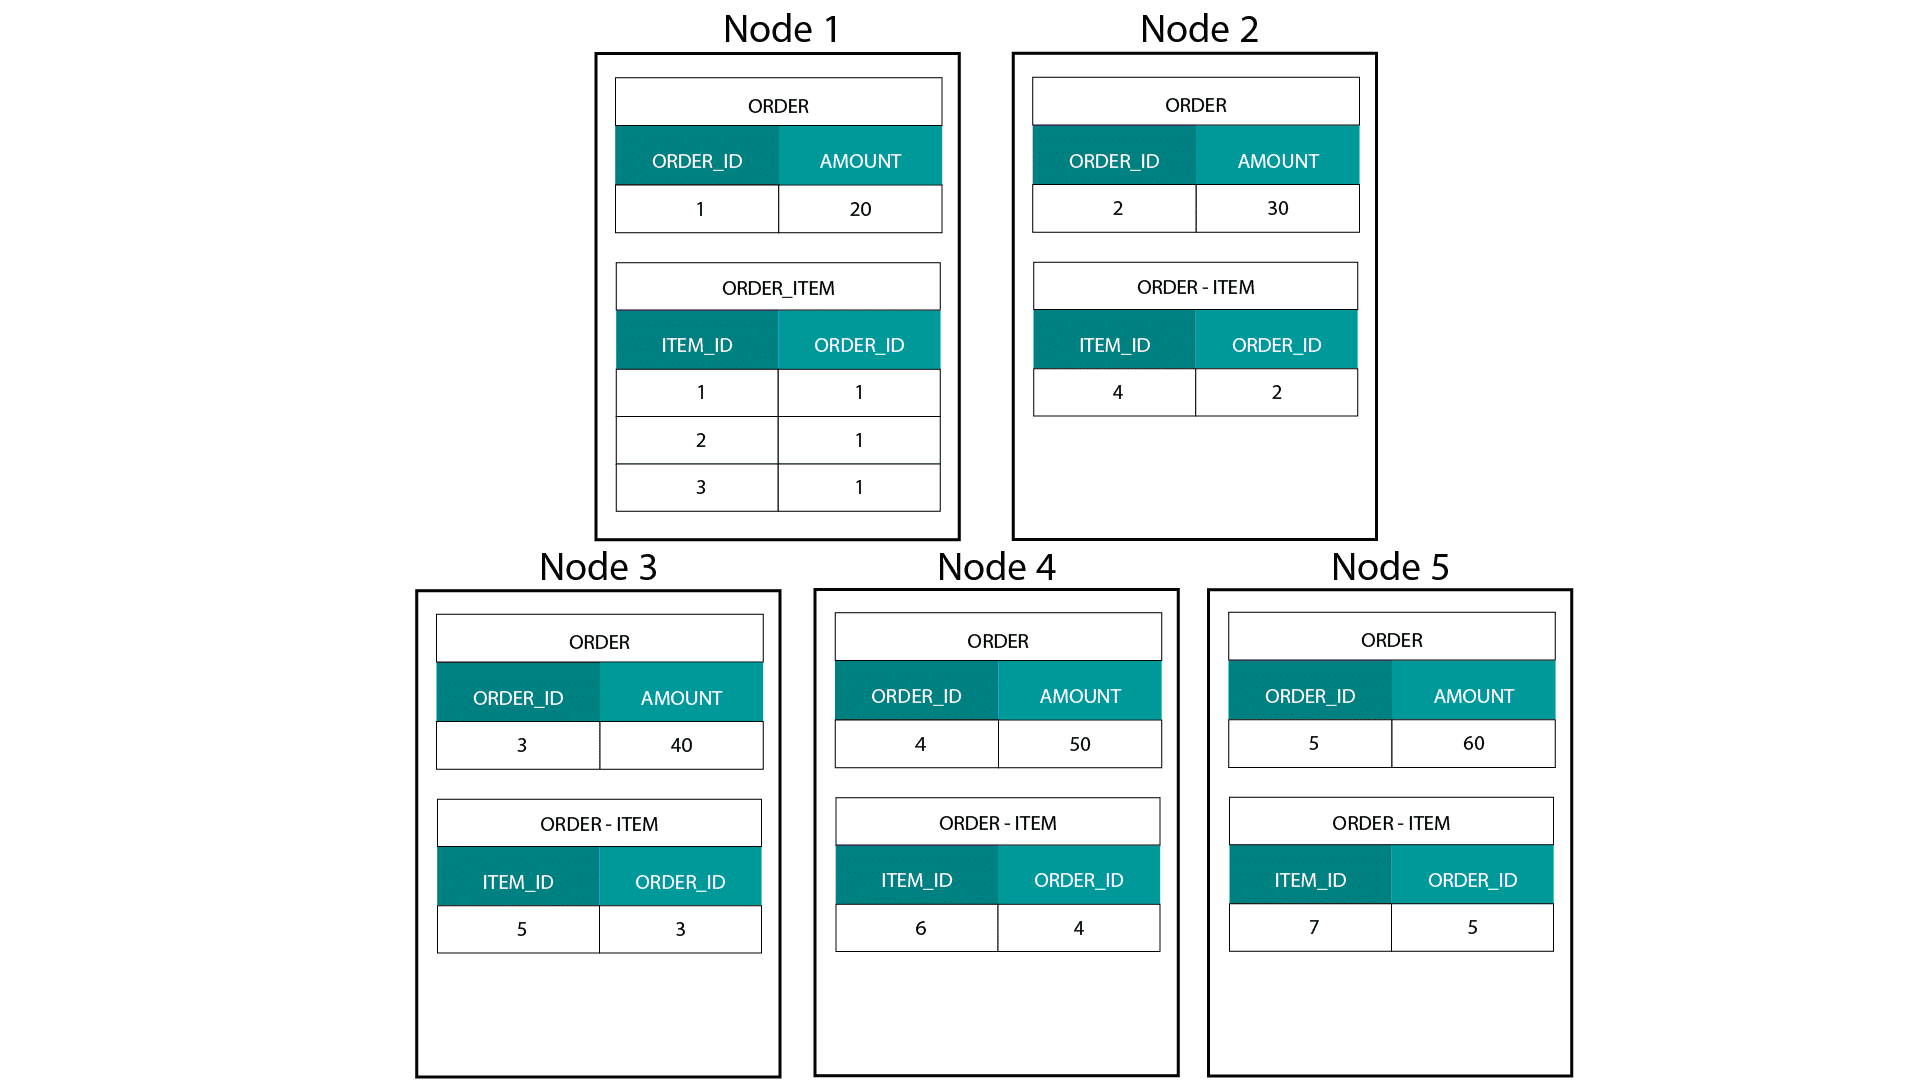
Keys for order_id of order and order_item table are co-located on the same nodes.
Data Distribution on Hadoop
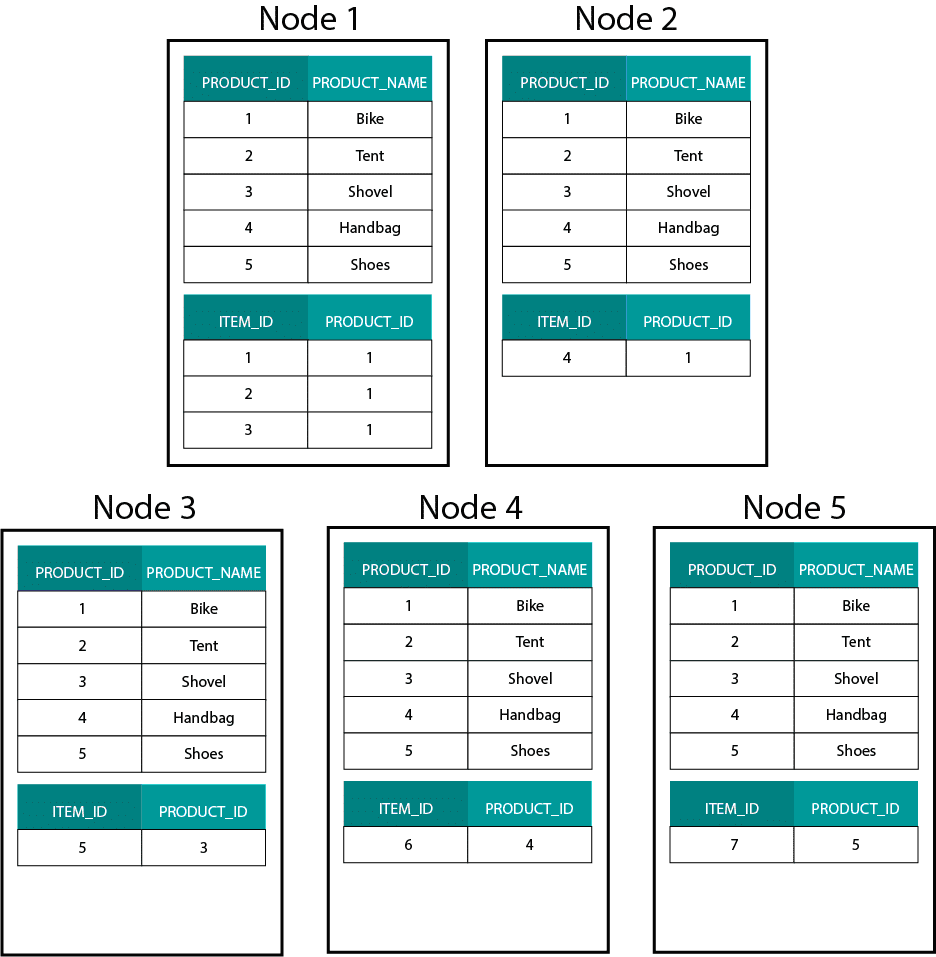
This is very different from Hadoop based systems. There we split our data into large sized chunks and distribute and replicate it across our nodes on the Hadoop Distributed File System (HDFS). With this data distribution strategy we can’t guarantee data co-locality. Have a look at the example below. The records for the ORDER_ID key end up on different nodes.
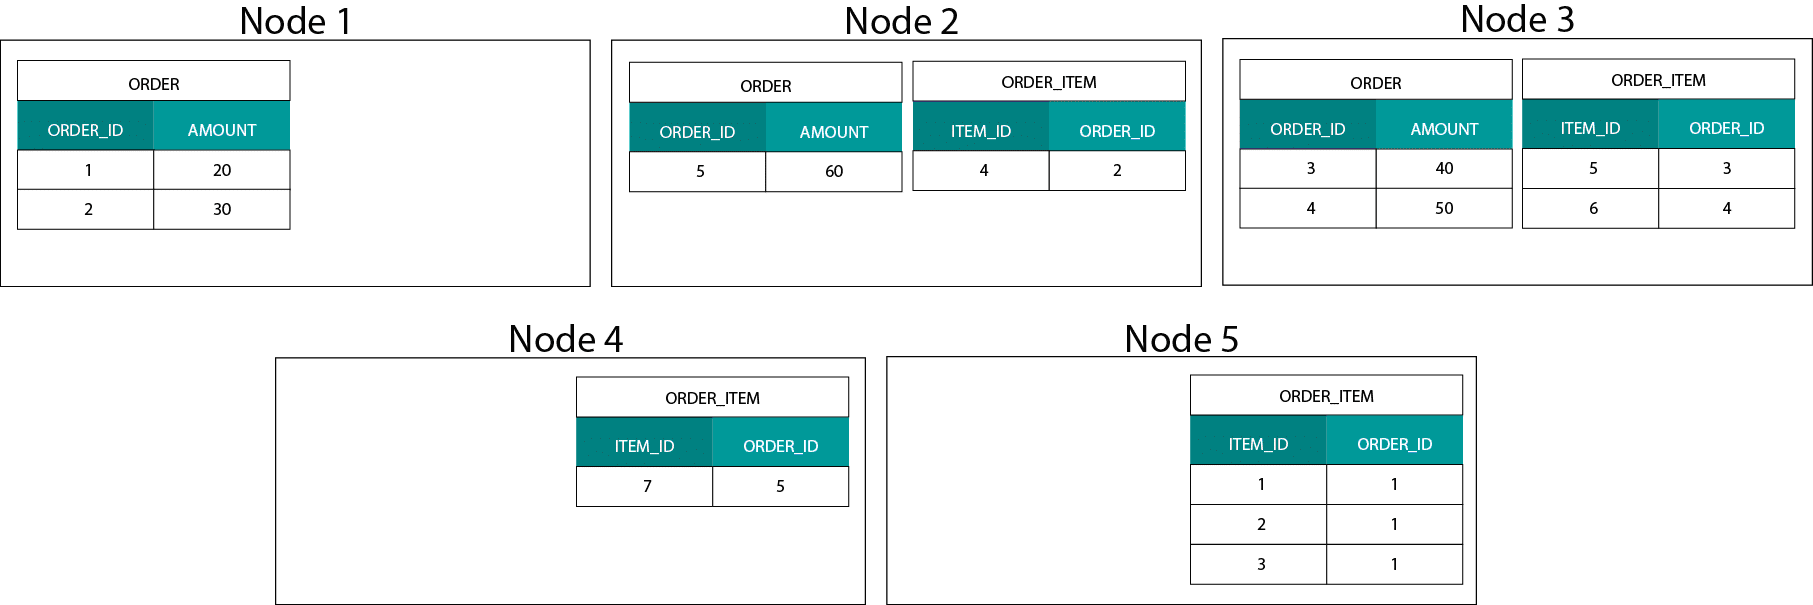
In order to join, we need to send data across the network, which impacts performance.
One strategy of dealing with this problem is to replicate one of the join tables across all nodes in the cluster. This is called a broadcast join and we use the same strategy on an MPP. As you can imagine, it only works for small lookup or dimension tables.
So what do we do when we have a large fact table and a large dimension table, e.g. customer or product? Or indeed when we have two large fact tables.
Dimensional Models on Hadoop
In order to get around this performance problem we can de-normalize large dimension tables into our fact table to guarantee that data is co-located. We can broadcast the smaller dimension tables across all of our nodes.
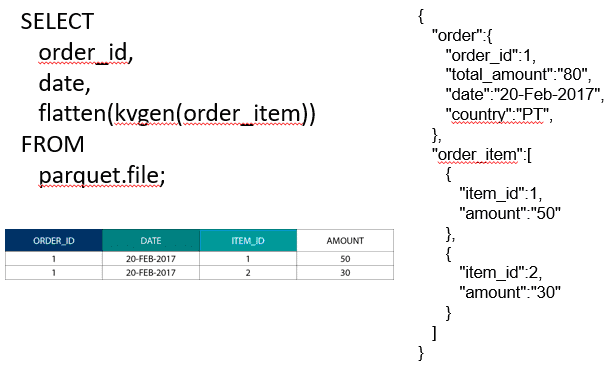
For joining two large fact tables we can nest the table with the lower granularity inside the table with the higher granularity, e.g. a large ORDER_ITEM table nested inside the ORDER table. Modern query engines such as Impala or Drill allow us to flatten out this data
This strategy of nesting data is also useful for painful Kimball concepts such as bridge tables for representing M:N relationships in a dimensional model.
Hadoop and Slowly Changing Dimensions
Storage on the Hadoop File System is immutable. In other words you can only insert and append records. You can’t modify data. If you are coming from a relational data warehouse background this may seem to be a bit odd at first. However, under the hood databases work in a similar way. They store all changes to data in an immutable write ahead log (known in Oracle as the redo log) before a process asynchronously updates the data in the data files.
What impact does immutability have on our dimensional models? You may remember the concept of Slowly Changing Dimensions (SCDs) from your dimensional modelling course. SCDs optionally preserve the history of changes to attributes. They allow us to report metrics against the value of an attribute at a point in time. This is not the default behaviour though. By default we update dimension tables with the latest values. So what are our options on Hadoop? Remember! We can’t update data. We can simply make SCD the default behaviour and audit any changes. If we want to run reports against the current values we can create a View on top of the SCD that only retrieves the latest value. This can easily be done using windowing functions. Alternatively, we can run a so called compaction service that physically creates a separate version of the dimension table with just the latest values.
Storage evolution on Hadoop
These Hadoop limitations have not gone unnoticed by the vendors of the Hadoop platforms. In Hive we now have ACID transactions and updatable tables. Based on the number of open major issues and my own experience, this feature does not seem to be production ready yet though . Cloudera have adopted a different approach. With Kudu they have created a new updatable storage format that does not sit on HDFS but the local OS file system.
It gets rid of the Hadoop limitations altogether and is similar to the traditional storage layer in a columnar MPP. Generally speaking you are probably better off running any BI and dashboard use cases on an MPP, e.g. Impala + Kudu than on Hadoop. Having said that MPPs have limitations of their own when it comes to resilience, concurrency, and scalability. When you run into these limitations Hadoop and its close cousin Spark are good options for BI workloads. We cover all of these limitations in our training course Big Data for Data Warehouse Professionals and make recommendations when to use an RDBMS and when to use SQL on Hadoop/Spark.
The verdict. Are dimensional models and star schemas obsolete?
We all know that Ralph Kimball has retired. But his principle ideas and concepts are still valid and live on. We have to adapt them for new technologies and storage types but they still add value.
Complementary Reading on Dimensional Modelling in the Era of Big Data
Tom Breur: The Past and Future of Dimensional Modeling
Edosa Odaro: 5 Radical Tips for Speedy Big Data Integration - The Anti Data Warehouse Pattern
Uli Bethke
CEO at Sonra

Latest posts by Uli Bethke (see all)
- JSON. To ETL or to NoETL? The big data question. - 29 March 2018
- What are the Benefits of Graph Databases in Data Warehousing? - 12 February 2018
- Dimensional Modeling and Kimball Data Marts in the Age of Big Data and Hadoop - 28 January 2018

