
Twitter can predict hurricane damage as well as emergency agencies
- by 7wData
In October 2012, meteorologists noticed a massive low-pressure system forming over the waters south of Cuba. In just 5 days, it spun into one of the largest hurricanes on record, cutting a path up the eastern U.S. coast and devastating communities with flooding and 140-kilometer-per-hour winds. Superstorm Sandy posed a massive problem for government clean-up crews. Where should they send their limited emergency supplies and services? A new study suggests a way to get that answer fast: Just listen to Twitter.
Mapping damage is a crucial first step in hurricane response. Inaccurate mapping, as there was with Sandy and even more so with Hurricane Katrina in 2005, can add up to weeks—and in some cases months—before help arrives to those most in need. To predict where the worst damage has occurred, the U.S. Federal Emergency Management Agency (FEMA) puts together models that look at everything from geography to infrastructure to storm characteristics, and then flies over the affected areas to further refine their map. Surveying people on the ground in natural disaster zones is just too difficult.
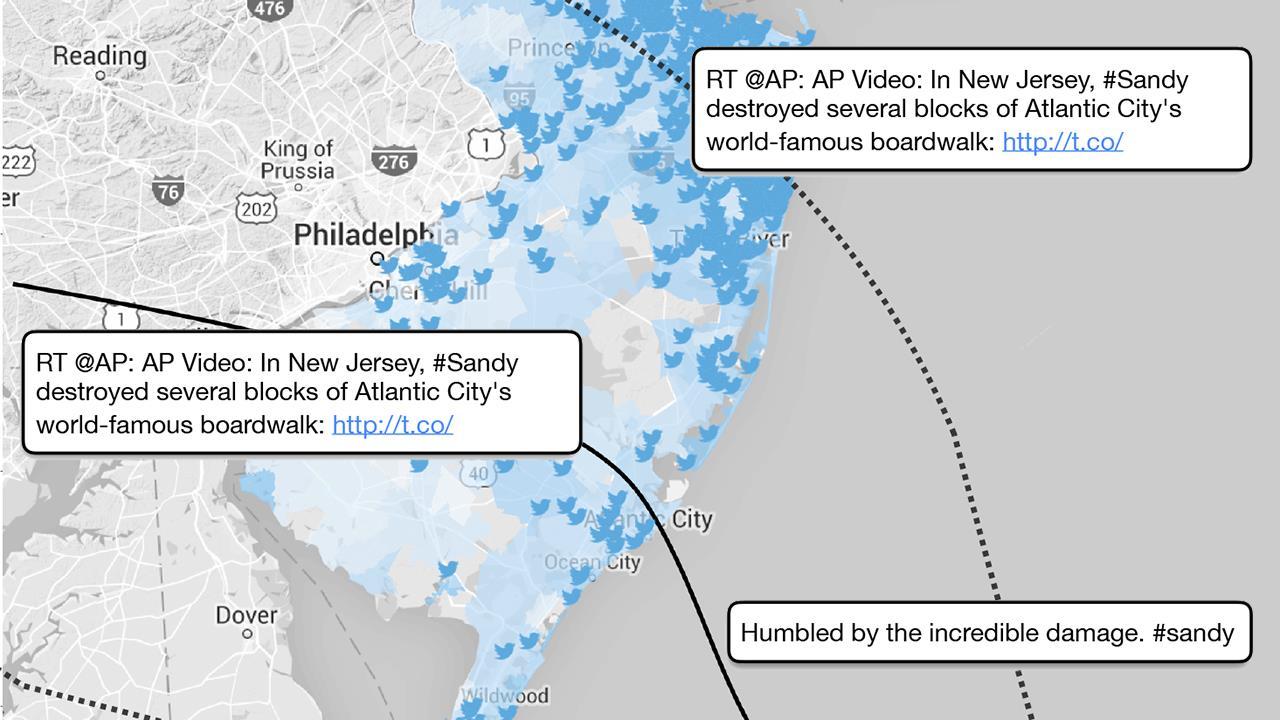
A team led by Yury Kryvasheyeu, a computational physicist at Australia’s National Information and Communications Technology Research Centre of Excellence in Melbourne, wondered whether better data might already be waiting online. By 2012, people were relying on social media apps such as Twitter to communicate about real-time events. But can a map of tweets be translated to a map of damage?
Kryvasheyeu’s first task was to get the data. Though Twitter opened up its full archive to researchers back in 2014, many academics have been worried about the legal strings that might be attached to using the California-based company's data. But the team only needed a subset for their experiment, so they bought it from one of the many third-party companies that collects, processes, and resells Twitter data. The database included all tweets in the world between 15 October and 12 November 2012. The team then narrowed the set to those with words like “hurricane,” “Sandy,” “frankenstorm,” and “flooding.;
[Social9_Share class=”s9-widget-wrapper”]
Upcoming Events
Evolving Your Data Architecture for Trustworthy Generative AI
18 April 2024
5 PM CET – 6 PM CET
Read MoreShift Difficult Problems Left with Graph Analysis on Streaming Data
29 April 2024
12 PM ET – 1 PM ET
Read More
