
Find hidden insights in your data: Ask why and why again
- by 7wData
We’ve all encountered a curious little kid who wouldn’t stop asking “why.” But did you ever think that, in the business world, you should actually aim to bethat kid? That’s because people -- whether we’re talking about children, journalists, scientists, managers or data analysts -- don’t succeed by simply asking “what.”
Let’s say sales are down, costs are high and resources are underused -- all familiar scenarios, right? Being able to identify these problems is the easy part. The hard but crucial part is actually getting to the root cause of a problem so you can take action.
How do you do that? By asking why, and then asking it again.
There’s a good chance you’re familiar with something called the “5 Whys” technique. Sakichi Toyoda, who’s known in Japan as the "King of Japanese Inventors" and the founder of Toyota Motors, created it. In a nutshell, you ask “why” of a problem that’s been identified, and then continue asking “why” for each answer or explanation given. The primary goal of the technique is to determine the root cause of a defect so you can fix it.
Many businesses don’t enable this, to their detriment. Lots of businesses have dashboards or reports. They’re great at answering the “what” questions but what happens when you need to know more about what the data is showing? To apply the “5 Whys” technique, you need to be able explore the data beyond the limits of the dashboard. This way, you can answer the unexpected questions.
Put another way, dashboards should be the start, not the end.
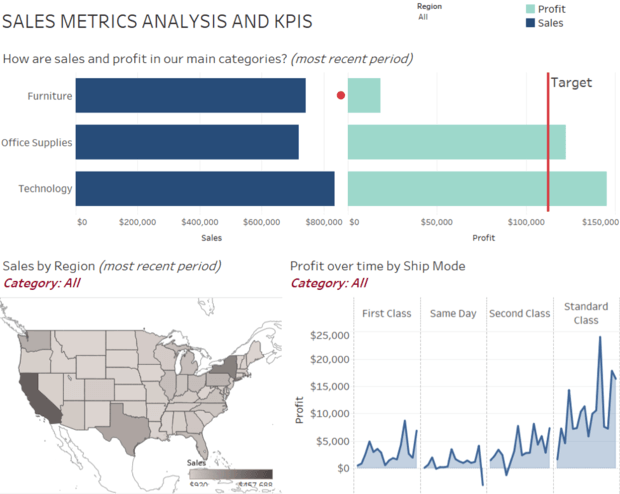
Let’s walk through an example. Pretend you are a big-box retailer and you have a beautiful dashboard showing your sales and profits. As you can see in the figure below, a bar chart answers the question: How are sales and profits in our main categories? It reveals a problem: as you can see, furniture is far from its profit target.
So, what do we do? We ask why.
One thing we can do is filter down to different regions or click on a category to show more detail in the map and line chart at the bottom:
But while this gives us more information, as seen above, it doesn’t really answer the question “Why are furniture profits low?” And that illustrates a key point: Investigating a question may start with drilling down and filtering. But with those steps, all we’re really getting is new views of the same question.
[Social9_Share class=”s9-widget-wrapper”]
Upcoming Events
Evolving Your Data Architecture for Trustworthy Generative AI
18 April 2024
5 PM CET – 6 PM CET
Read MoreShift Difficult Problems Left with Graph Analysis on Streaming Data
29 April 2024
12 PM ET – 1 PM ET
Read More
