
Data exploration from: An experiment in trying to predict Google rankings
- by 7wData
Over the last few months, we have been working with a company named Statec (a data science company from Brazil) to engineer features for predictive algorithms. One of the initial considerations in working with predictive algorithms is picking relevant data to train them on.
We set out quite naively to put together a list of webpage features that we thought may offer some value. Our goal was simply to see if from available features, we could get close to predicting the rank of a webpage in Google. We learned soon into this process that we had to put blinders on to data that was unreachable and hope for the best with what we had.
The following is an analysis of the data we collected, how we collected it and useful correlations derived from the data.
One initial problem was that we needed to gain access to ranking data for enough search engine results page (SERP) results to provide a useful training set. Luckily, GetStat made this very easy. With GetStat, we simply loaded up keyword combinations across the top 25 service industries with the location of the top 200 cities (by size) in the US. This resulted in 5,000 unique search terms (e.g., “Charlotte Accountant” taken from Charlotte, NC).
My company, Consultwebs, is focused on legal marketing, but we wanted the model to be more universal. After loading up the 5,000 terms and waiting a day, we then had roughly 500,000 search results we could use to construct our data set.
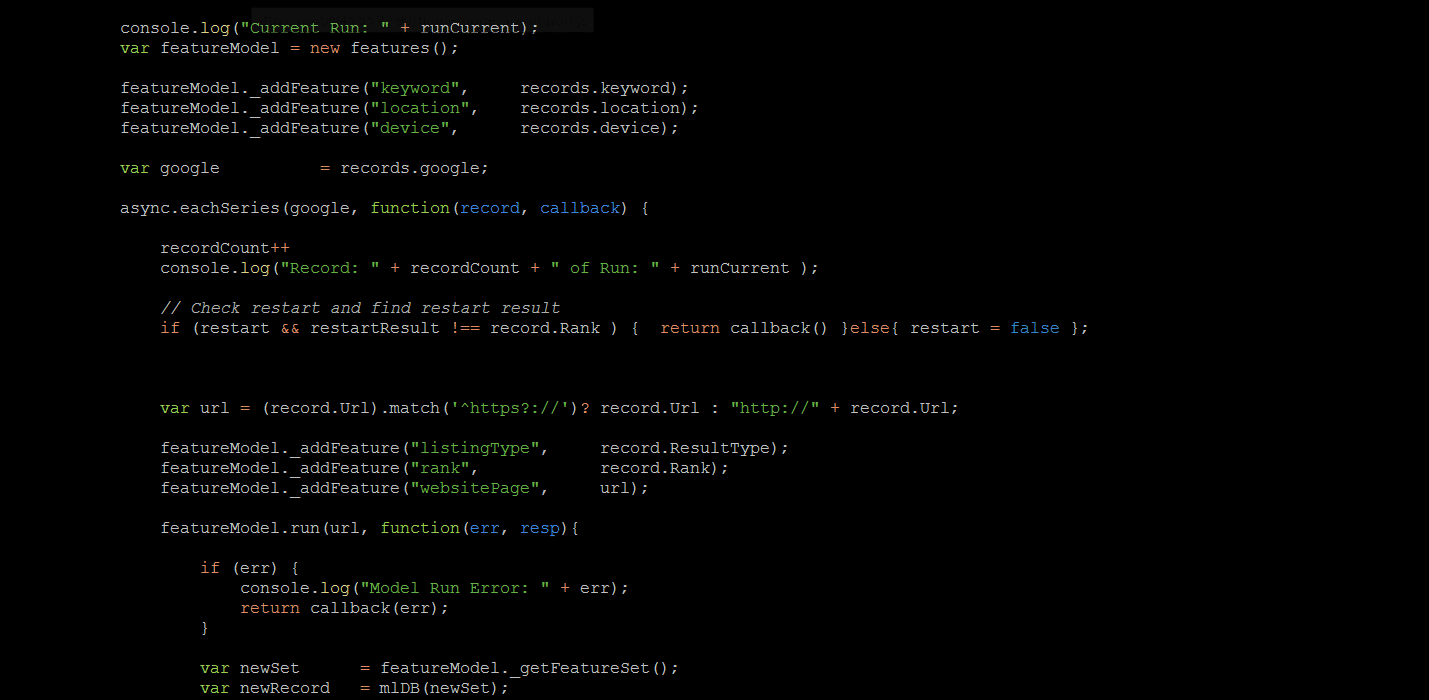
After finding this so easy, I collected the rest of the data. I had built several crawlers with Node.js, so I decided to build a feature extraction mechanism on top of pre-existing work. Luckily, Node.js is an excellent ecosystem for this type of job. Below I list several libraries that make Node wonderful for data collection:
The crawling process was very slow, due mainly to hit limits by API providers and our proxy service. We would have created a cluster, but the expense limited us to hitting a couple of the APIs about once per second.
Slowly, we gained a complete crawl of the full 500,000 URLs. Below are a few notes on my experience with crawling URLs for data collection:
We have reported our results from the ranking predictions in a separate post, but I wanted to review some of the interesting insights in the data collected.
For this data, we reduced the entire data set to only include rankings in the top 20 and also removed the top four percent of observations based on referring domains. The goal in removing the top four percent of referring domains was to keep URLs such as Google, Yelp and other large websites from having undue influence on the averages. Since we were focusing on service industry results, we wanted to make sure that local business websites would likely be compared, and not major directories.
In the chart below, we assume that the web designer category is the largest due to the practice of footer links from website work. The second two highest are no surprise to those of us who work in the legal niche.
Again we filtered to the top 20 ranking results across all observations and also removed the top four percent of observations based on referring domains to remove URLs from Google, Yelp and other large websites. Feel free to use this in proposals when qualifying needs for clients in particular cities.
The top results here are no surprise to those of us who have had clients in these cities. New York, in particular, is a daunting task for many niches.
For this data, we kept the full rank data at 100 results per search term, but we removed observations with referring domains over the top four percent threshold and over 5,000 Facebook shares. This was a minimal reduction to the overall size, yet it made the data plot much cleaner.
The plot reminds me of when I go out to the shooting range, in that there is really no order to shots. The Pearson correlation of average shares to rank is 0.
[Social9_Share class=”s9-widget-wrapper”]
Upcoming Events
Evolving Your Data Architecture for Trustworthy Generative AI
18 April 2024
5 PM CET – 6 PM CET
Read MoreShift Difficult Problems Left with Graph Analysis on Streaming Data
29 April 2024
12 PM ET – 1 PM ET
Read More
