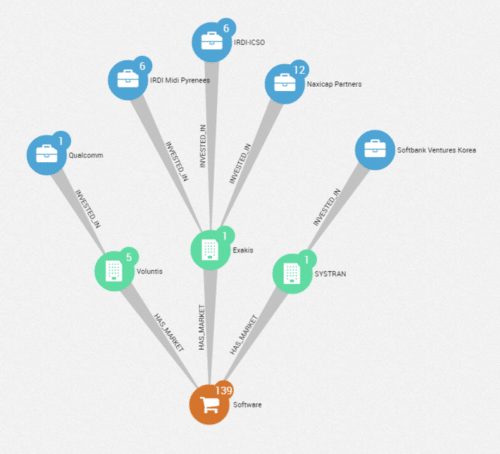
5 reasons why graph visualization matters
Why is graph visualization so important? How can it help businesses sifting through large amounts of complex data? We explore the answer in this post

Why is graph visualization so important? How can it help businesses sifting through large amounts of complex data? We explore the answer in this post
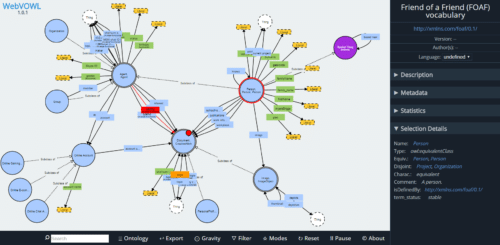
WebVOWL is a web application for the interactive visualization of ontologies. It implements the Visual Notation for OWL Ontologies (VOWL) by providing graphical depictions for

Data visualization is when you manually or otherwise organize and display data in a pictorial or graphic format in an attempt to enable your audience

In past decades, most of the business executives find tuff times in analyzing their business within a short period of time and struggled in taking

Visual business intelligence represents the summation of BI’s time-honored journey from the backrooms of IT departments to the front offices of business analysts and C

Data Science is an ever-growing field, there are numerous tools & techniques to remember. It is not possible for anyone to remember all the functions,
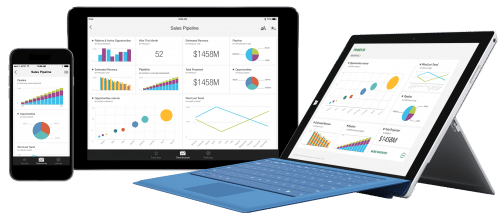
It has been a while since Microsoft launched its Power BI tool and the way things are going for this fabulous Business Intelligence and Analytics
