
Understanding Data Visualization Techniques
Data visualization is a graphical representation of information and data. By using visual elements like charts, graphs, and maps, data visualization tools provide an accessible way to

Data visualization is a graphical representation of information and data. By using visual elements like charts, graphs, and maps, data visualization tools provide an accessible way to

A data scientist should know how to effectively use statistics to gain insights from data. Here are five useful and practical statistical concepts that every

Benoît Barranco is a Customer Success Architect at Talend. He brings years of experience working with customers and partners across multiple industries, helping them in
The analysis of Internet of Things (IoT) data is quickly becoming a mainstream activity. I’ve written about the Analytics of Things (AoT) before (some examples

Discussed much more thoroughly in the last article AI in Banking, Artificial Intelligence (AI) is a powerful force for business. Does it have a place in Healthcare,
Preparing for an interview is not easy – naturally there is a large amount of uncertainty regarding the data science interview questions you will be

Detecting anomalous cases in large datasets is critical in conducting surveillance, countering credit-card fraud, protecting against network hacking, combating insurance fraud, and many more applications
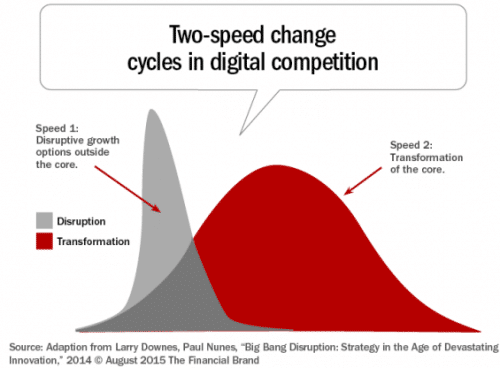
The disruptors in the banking industry are rewriting the rules followed for decades. But, these new rules will only suffice until the next wave of
Some of the techniques that have made Business Intelligence so successful over the past couple decades are its Achilles heel. This post contains a few
Hortonworks Inc. Chief Executive Rob Bearden grabs a napkin off the hotel conference room table at the San Jose Marriott and scrawls a bell curve
