Telling a Great Data Story: A Visualization Decision Tree
Have you ever seen a great-looking dashboard or report that doesn’t do much more than just look good? You can’t really figure out the story. It’s usually

Have you ever seen a great-looking dashboard or report that doesn’t do much more than just look good? You can’t really figure out the story. It’s usually
The amount of data generated and consumed by organizations is growing at an astounding rate. The total volume of data and information worldwide has risen

Here’s how most companies decide which data projects to pursue: Management identifies a set of projects it would like to see built and creates the

Data visualization uses algorithms to create images from data so humans can understand and respond to that data more effectively. Artificial intelligence development is the

For years, SEOs have faced multiple paths when it comes to career development options. For some, the general options involving web development or traditional marketing

To many, data can seem dull at first glance, just a series of ones and zeros that don’t seem to be worth paying much attention

Data Science is an ever-growing field, there are numerous tools & techniques to remember. It is not possible for anyone to remember all the functions,

We wanted to gather and analyze news content in order to look for similarities and differences in the way two journalists write headlines for their

Topological data analysis has been very successful in discovering information in many large and complex data sets. In this post, I would like to discuss

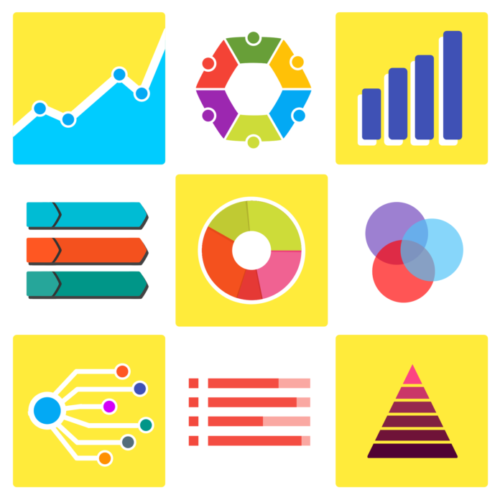
Data visualization is increasingly at the center of how we digest information. The last several decades have seen an explosion in the use of charts,
There are thousands of Big Data tools out there. All of them promising to save you time, money and help you uncover never-before-seen business insights.
