
7 Compelling Visualizations That Show The Power and Value of Maps
Maps tell stories. As we’ve written on this blog before, they are an important and useful tool in simplifying complex information for the purpose of

Maps tell stories. As we’ve written on this blog before, they are an important and useful tool in simplifying complex information for the purpose of

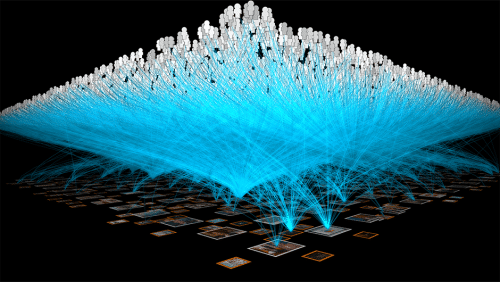
Georgia State University created a technology-rich visualization space that supports research and instruction and explores the transformative potential of visual media across all disciplines.

Marketers across the globe can all agree on one thing: data is everywhere and it’s overwhelming! A recent study conducted by the Economist Intelligence Unit

For more than a year, with the help of an OpenGov Grant from the Sunlight Foundation, Solomon Kahn has been building a visualization system

Governments around the world have released more than a million open data sets over the last decade. Analyzing that data — when it’s accurate —
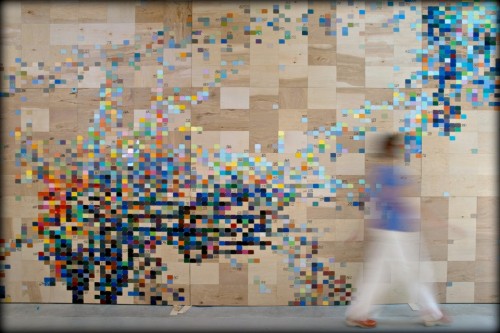
Art is as much a product of the technologies available to artists as it is of the sociopolitical time it was made in, and

There are many misconceptions about the impact artificial intelligence (AI) is having on the enterprise, that it could become so advanced that it threatens
Knowledge is power. That is the old adage, anyway. What do you do if you’ve got terabytes of data about your customers but no
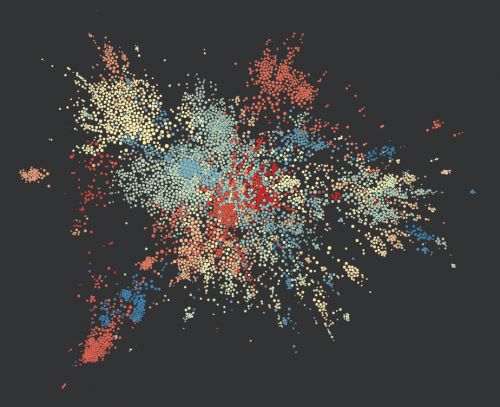
Randy Olson was a “complete amateur” when he began haunting the data visualization corners of the social networking and content-sharing site reddit. “I started

Retailers have long known the value of developing data warehouses and similar repositories to amass point of sale (POS) data, and information from systems

Data visualization is a powerful tool to communicate complex information in an engaging way. By visualizing information, our brains can synthesize and retain content more
