
How to Turn Big Data into Big Wins: 3 Tools
- by 7wData
Knowledge is power. That is the old adage, anyway.
What do you do if you've got terabytes of data about your customers but no way to organize, understand, or make use of it? Owing to the Internet and the ease of creating and storing data, we now have an astonishing amount of information. And it's not going to stop.
According to the Digital Universe Study there will be 40 zettabytes of data in the world by 2020. That's 40 x 10 to the 21 st power (10 21) or 5,247 GB for every man, woman and child on the planet.
Let's put things in perspective. By the time you finish reading this sentence an hour of video will be uploaded to YouTube , five new Facebook profiles will have been created, and around 800 Tumblr posts will have been added. That's what one second looks like on the web .
Even with the help of computers, algorithms, and machine learning programs, we're often still paralyzed by this flood of information.
Why? Because the vast majority of it isn't presented in a way that helps us not only understand it, but put it into action.
Tesco supermarket chain has collected 70m refrigerator data points from its units, which are then analyzed. This allowed the company to gauge the performance, maintenance needs, and efficiency of the refrigerators and had a notable impact on energy costs.
In the end, tesco has saved over $25 million.
Even more notable were the efforts by Morton's The Steakhouse to please a customer who jokingly tweeted the restaurant to ask for his dinner to be sent to his flight.
The company realized he was a regular customer, pulled data on his usual orders, and then found out which flight he was on. They then sent a waiter in black tie to serve him dinner.
Yes, it may have been a publicity stunt, but it also showcases the power of data.
American Express in Australia also showcased the power of data when they created an algorithm that could predict loyalty through analysis of historical transactions.
This allowed the credit card company to forecast churn and identify accounts that will close within four months.
So, to help you make sense of all this big data, here are three tools every web-based business should be using.
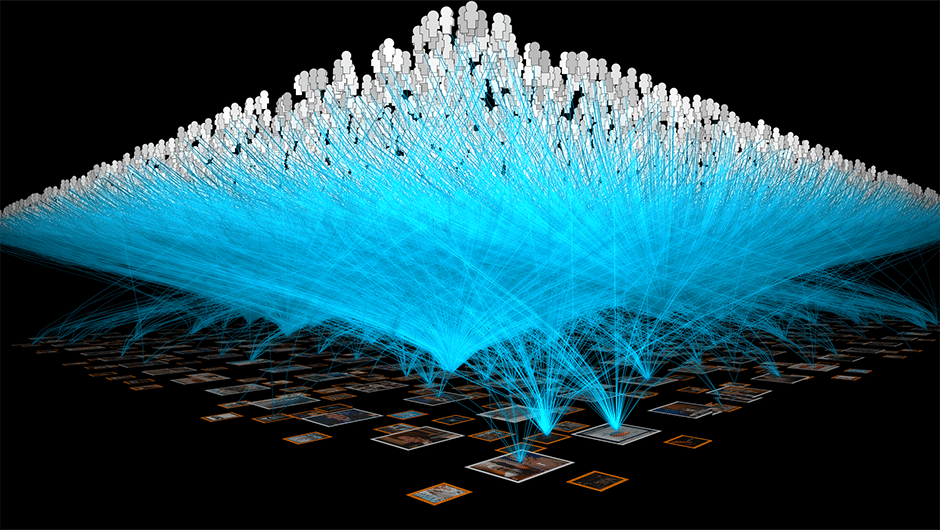
Visualization
We need to be able to see our data to make sense of it.
Spreadsheets filled with numbers or logs of entries don't allow us to understand what we're seeing. To us human beings they're individual pieces of micro data and just too hard to make useful.
The next step is bringing all of our data together into one place.
Integration helps us make sense of data, analyze it, and move to action. So much time gets wasted sourcing and compiling different sources of data.
Lack of integration not only costs money, it makes it impossible to see the bigger picture.
The previous examples show the more data we have, the more we can predict and the better we perform. But it is not just your own data that can be useful.
Your competitors also can be fantastic teachers and being able to monitor their metrics, whether they are movements in rank on Google or new Twitter followers, can provide you with details of who is doing the right things and how.
[Social9_Share class=”s9-widget-wrapper”]
Upcoming Events
From Text to Value: Pairing Text Analytics and Generative AI
21 May 2024
5 PM CET – 6 PM CET
Read More