
CartoDB: From Alcatraz to elephants, startup puts open source visualisation on the map
- by 7wData
Sometimes, creating a successful business isn't just a matter of having a good idea. Sometimes, what you really need is luck.
Javier de la Torre and Sergio Álvarez Leiva certainly had luck when they published the right material at the right time.
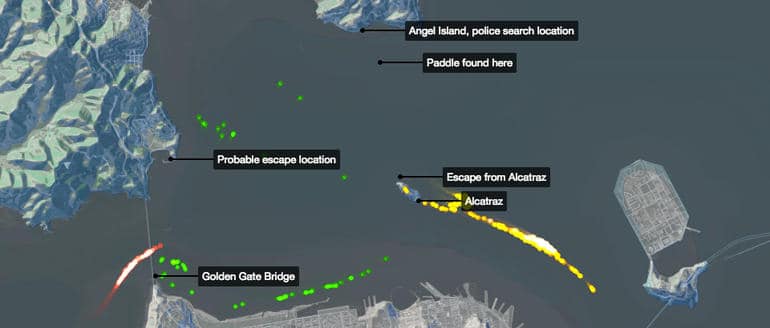
In 2007, they started working together on a data visualization project involving conservation and biodiversity. They both like science and were curious to know how protected areas help conserve endangered species, so they took public data from different UN agencies, analyzed it, and published the results in a blog entitled Biodivertido. As luck would have it, the United Nations saw the result, contacted them to say it had long wanted to do something similar - and said it wanted to hire them.
They created software to process millions of data points and display the results on a map to help better understand a problem or tell a story. Thus Vizzuality - their company - and CartoDB - its flagship product - were born, thanks to bootstrapping, some public funding, and hard work.
Think big data is too big for SMEs? Barcelona's out to prove you wrong
The company cofounder recognizes that "seeking funding makes you realize the issues at hand".
[Social9_Share class=”s9-widget-wrapper”]
Upcoming Events
Shift Difficult Problems Left with Graph Analysis on Streaming Data
29 April 2024
12 PM ET – 1 PM ET
Read MoreCategories
You Might Be Interested In
3 Ways to Detect Lying Data Visualizations
15 Aug, 2015When it comes to data, a little bit of skepticism goes a long way. People are often willing to accept …
Data Visualization for the Rest of Us
14 Jan, 2016Linda Hofschire knew something had to be done. An analyst at Library Research Service at Colorado State Library (CSL), Hofschire …
What Killed The Infographic?
20 Jun, 2015A few years ago, the Internet was awash in groundbreaking data visualizations. There was Aaron Koblin’s deeply influential map …
Recent Jobs

Do You Want to Share Your Story?
Bring your insights on Data, Visualization, Innovation or Business Agility to our community. Let them learn from your experience.
Privacy Overview
Get the 3 STEPS
To Drive Analytics Adoption
And manage change
