
Teaching the Data Science Process
- by 7wData
Understanding the process requires not only wide technical background in machine learning but also basic notions of businesses administration; here I will share my experience on teaching the data science process.
Curricula for teaching machine learning have existed for decades and even more recent technical subjects (deep learning or big data architectures) have almost standard course outlines and linearized storylines. On the other hand, teaching support for the data science processhas been elusive, even though the outlines of the process have been around since the 90s. Understanding the process requires not only wide technical background in machine learning but also basic notions of businesses administration. I have elaborated on the organizational difficulties of data science transformation stemming from these complexities in a previous essay; here I will share my experience on teaching the data science process.
The data science ecosystem. Data scientists “B” is in key position in formalizing the business problem and designing the data science workflow.
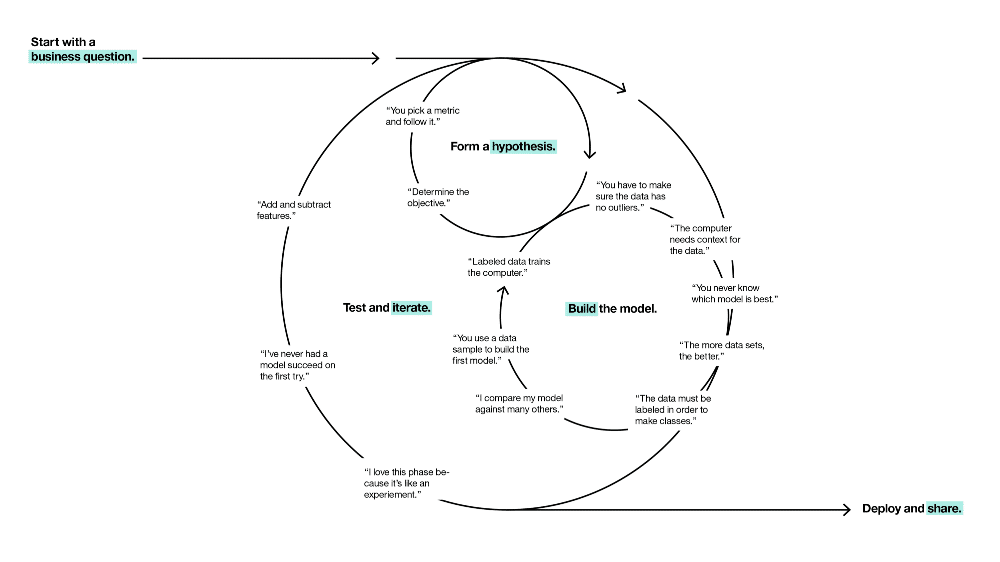
I recently had the opportunity to try some experimental pedagogical techniques on about hundred top tier engineering students from Ecole Polytechnique. The central concept of the course was the data science workflow.
None of these two can be taught using linearized narratives in slide-based lectures. I built the course around our RAMP concept using our platform. To learn workflow optimization, students participated in five RAMPs, designed to challenge them on different scientific workflows and on different data science problems. To learn workflow design, I covered a couple of data-driven business cases, gave students a linear guide with specific questions to answer to, and asked them to build business cases and data science workflows in group projects. I used the RAMP starting kits as samples: limiting the infinite design space helped students to structure the projects.
The RAMP was originally designed for a collaborative prototyping tool that makes efficient use of the time of data scientists in solving the data analytics segment of domain science or business problems. We then realized very soon that it is equally valuable for training novice data scientists. The main design feature we needed to change was complete openness. To be able to grade students based on individual performance, we needed to close the leaderboard. In the closed phase students see each other’s scores but not each other’s codes. We grade them using a capped linear function of their score. This typically 1–2 week long closed phase is followed by a “classical” open RAMP in which we grade students based on their activities and their ability of generating diversity and improving their own closed phase score.
The collective performance of the students was nothing short of spectacular. In all five RAMPs they beat not only the baseline but also the single day hackaton scores that we organized to test the workflows, with typically 30–50 top data scientists and domain scientists participating.
Score vs submission timestamp of the first classroom RAMP. Blue and red circles represent submissions in the closed and open phases, respectively.
[Social9_Share class=”s9-widget-wrapper”]
Upcoming Events
From Text to Value: Pairing Text Analytics and Generative AI
21 May 2024
5 PM CET – 6 PM CET
Read More