
How To Choose A Successful Infographic Concept
- by 7wData
The success of your infographic is determined long before your graphic designer starts working in Illustrator or Photoshop. It’s even settled before your writer starts researching. The true success of an infographic lies in its concept. This is the seed of the infographic, from which everything else follows.
A good execution of that infographic concept matters, obviously. But if you don’t have a strong concept, then it won’t reach its potential. If you want to choose a concept that will boost your business, make sure it satisfies these four criteria.
What exactly do you hope to get out this infographic? Do you want to position yourself as a thought leader? Do you want it to spread through a social media community? Do you want to earn backlinks for SEO?
Before you even think about your concept, get clear on what you want the infographic to achieve.
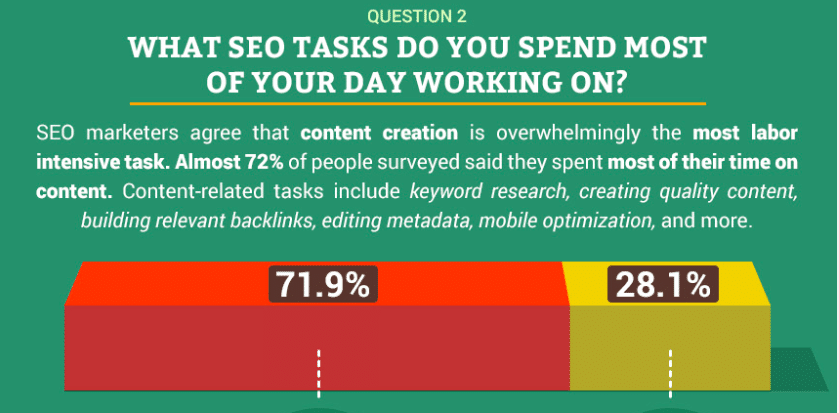
Let’s say you want to position yourself as a thought leader. Your infographic concept might revolve around original research, which you can present through data visualization. For example, check out this infographic from Search Engine Journal about what SEO experts are working on.
That data comes from an original survey of 65 top SEOs. The concept not only gives Search Engine Journal readers useful information, but it also establishes Search Engine Journal as a publication that has its finger on the pulse on the search industry.
An infographic about blues guitarists might be smart if you’re a music store — but it might not be a good idea if you’re a computer repair shop.
An infographic is more than just a pretty way to present information. It’s also a reflection what you value as a business. So it should always connect to the image you want to present to the world. Take for example, this infographic aout the most iconic glass bottles from O Berk.
[Social9_Share class=”s9-widget-wrapper”]
Upcoming Events
Shift Difficult Problems Left with Graph Analysis on Streaming Data
29 April 2024
12 PM ET – 1 PM ET
Read MoreCategories
You Might Be Interested In
Wear Patterns: How What’s Missing Can Help Us See Data Better
14 May, 2016It started with some colored pencils. A little girl said her favorite color was pink. Her dad said he could …
The Smart City Ecosystem as an Innovation Model: Lessons from Montreal
2 Dec, 2016Since the early 2000s, many cities around the world have undertaken initiatives to position themselves as “smart cities”. Indeed, in …
Data from 130 million commuters reveal US ‘megaregions’
9 Dec, 2016The daily commutes of more than 130 million Americans have been used to identify commuter-based megaregions in the United States …
Recent Jobs

Do You Want to Share Your Story?
Bring your insights on Data, Visualization, Innovation or Business Agility to our community. Let them learn from your experience.
Privacy Overview
Get the 3 STEPS
To Drive Analytics Adoption
And manage change
