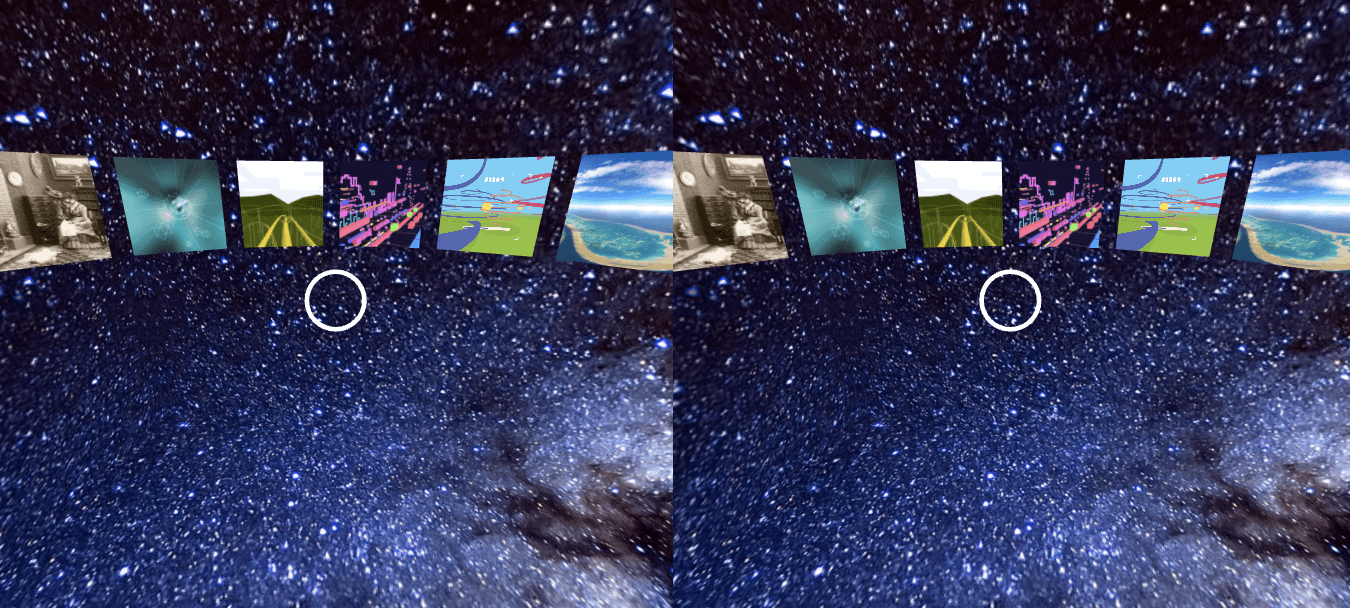
8 Immersive Virtual Reality Data Visualizations

8 Immersive Virtual Reality Data Visualizations

Imagine stepping into a three-dimensional data visualization that lets you fully interact with the data. This is now possible thanks to virtual reality technology.

Virtual reality data visualizations are computer generated, highly interactive, 3D projects. While the concept of VR isn’t new, the idea of immersive data exploration most certainly is – and the exciting possibilities are endless.

VR visualizations have the potential to offer easier pattern recognition and retention. They also feature different perspectives beyond the two-dimensional images we are familiar with. Let’s take a look at 8 amazing data visualizations in virtual reality:

The United Kingdom voting on whether to stay in the European Union or to “Brexit” was a huge story across Europe. Google Labs decided to make an interactive guide to the UK’s EU referendum. They created a VR visualization which simply illustrates the top questions asked in each country on search.

The blue whale is the largest animal on the planet. Simon Ducroquet and the Interactive Team at Fusion wanted to show what it would be like to swim around a blue whale, breaking down its complex anatomy and behavior. Click here to view a full step-by-step layout of the design process.

Titans of Space 2.0 is a deep-dive tour through our Solar System. The goal was to gain a new perspective on what our universe actually looks like by taking advantage of the increased spatial awareness made possible by modern VR.


Share it:
Share it:

[Social9_Share class=”s9-widget-wrapper”]

Leave a Reply

Your email address will not be published. Required fields are marked *

This site uses Akismet to reduce spam. Learn how your comment data is processed.

You Might Be Interested In

How To Choose A Successful Infographic Concept

31 Dec, 2016

The success of your infographic is determined long before your graphic designer starts working in Illustrator or Photoshop. It’s even settled …

Read more

Data Product Canvas — A practical framework for building high-performance data products

27 Aug, 2022

Do you know why most data products fail? It is because they are not always aligned with the real objectives …

Read more

Blast from the past: Three incredible examples of early data journalism

11 Jul, 2017

The growth and consumption of information, and the rise of data science specifically, continues to open up new areas of …

Read more

Recent Jobs

IT Engineer

Washington D.C., DC, USA

1 May, 2024

Read More

Data Engineer

Washington D.C., DC, USA

1 May, 2024

Read More

Applications Developer

Washington D.C., DC, USA

1 May, 2024

Read More

D365 Business Analyst

South Bend, IN, USA

22 Apr, 2024

Read More

Do You Want to Share Your Story?

Bring your insights on Data, Visualization, Innovation or Business Agility to our community. Let them learn from your experience.

Get the 3 STEPS

To Drive Analytics Adoption
And manage change

3-steps-to-drive-analytics-adoption

Get Access to Event Discounts

Switch your 7wData account from Subscriber to Event Discount Member by clicking the button below and get access to event discounts. Learn & Grow together with us in a more profitable way!

Get Access to Event Discounts

Create a 7wData account and get access to event discounts. Learn & Grow together with us in a more profitable way!

Don't miss Out!

Stay in touch and receive in depth articles, guides, news & commentary of all things data.