
Seeing through Data: Visiting the Museum with the Eyes of an Information Designer
- by 7wData
Last December I’ve had the pleasure to teach a 6 hour-workshop at the Department of Education at the Museum of Modern Art, a class called “ Draw your Visit with Data ”, where we explored what using data — small and subjective data — as an observational tool and as a creative material could bring to, for example, the way we experience an exhibition.
The workshop was part of my ongoing research on what I call Data Humanism : an approach to the data world through which, I argue, we are ready to question the impersonality of a merely technical approach to data, and to reconnect numbers to what they really stand for: our lives.
Specifically, it is an opportunity to investigate how we can find and use data in contexts you wouldn’t expect — as a second pair of eyes: to learn how to see more and better, and to explore how small and subjective data can be an observational tool and a creative material we could bring to, for example, the way we experience an exhibition.
During the one-day workshop, we focused on a specific exhibition with works exclusively from the 1960s, “a decade in which interdisciplinary artistic experimentation flourished, traditional mediums were transformed, and sociopolitical upheaval occurred across the globe.” In the very nature of the exhibition, there is purposely no narrative that links the artworks other than chronology. Thus participants needed to find their own story, using data as the guiding material to build their own personal, unique experience.
The limited amount of time and the vast number of pieces (over 350 artworks) forced them to pick a criterion to decide which artworks to look at in the first place.
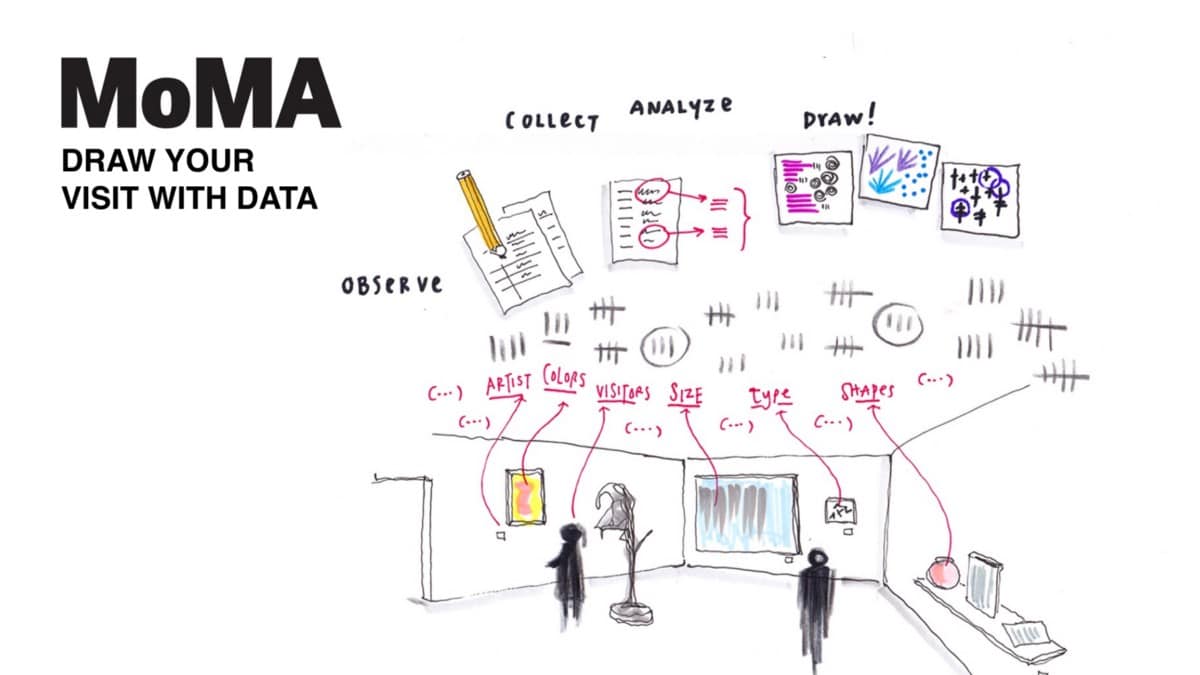
They then walked through the galleries with the eyes of data collectors, producing multidimensional datasets by observing four elements per piece of their choice.
They detected qualitative and quantitative details about each artwork: it’s type and feature, the artist’s demographics, or even more fluid data such as their subjective experience of it or how other visitors would interact with the pieces — a somehow volatile but inherent part of the museum experience.
Workshop participants collecting data in From the Collection: 1960–1969. Photo: Manuel Martagon. © 2017 The Museum of Modern Art, New York
Workshop participant organizing his own data. Photo: Manuel Martagon. © 2017 The Museum of Modern Art, New York
We also explored ways to take visual inspiration from what we observe and translate it into abstract symbols to guide a data drawing. We learned to dissect the qualities and features of what we like and then use them as design materials.
Images from my presentation to the students — you can download the pdf from here
In fact, I believe that learning to see and to reproduce the aesthetic traits that attract our eyes to our surroundings is essential for creators of any kind. Looking for clues in unusual contexts and mapping out what our mind’s eye is captured by is an invaluable resource for inspiration and a guiding principle to any kind of design; if a set of aesthetic rules for shapes, for colors, and for spatial composition works in a context we observe, there should be a way to apply them to the designs we are working on.
Attendees didn’t have any previous data or design backgrounds, but the results were really stunning. In fact, even though for many the words “data visualization” might be associated with heavy programming or statistical skills, complex softwares, and huge numbers, great results and insights can be achieved by approaching data in this very manual, analog way.
[Social9_Share class=”s9-widget-wrapper”]
Upcoming Events
From Text to Value: Pairing Text Analytics and Generative AI
21 May 2024
5 PM CET – 6 PM CET
Read More